


Contents
Scroll to:
https://doi.org/10.20996/1819-6446-2023-2940
EDN: UIWFYM
Scroll to:
Aim. To outline echocardiographic features and assess their prognostic significance for major cardiovascular adverse events (MACEs) within 12 months in patients with type 2 myocardial infarction (MI), compared to type 1 MI (T1MI).
Material and methods. The prospective observational study included 161 MI patients who underwent coronary angiography within 24 hours of admission. Type 2 MI (T2MI) diagnosis aligned with the Fourth Universal Definition. Echocardiography and speckle-tracking echocardiography were performed within 72 hours of hospitalization. MACEs encompassed cardiovascular death, non-fatal MI, non-fatal stroke, and HF-related readmissions. Logistic regression analysis was conducted to evaluate their associations with the outcomes.
Results. T2MI were diagnosed in 74 patients (median age, 65 years; males, 55,4%). During follow up, 18 patients for each MI type experienced at least one MACE event. Left ventricular (LV) systolic dysfunction (LV ejection fraction [LVEF] <50%) was observed in 41 (55.4%) T2MI patients, compared with 66 (75.9%) T1MI patients (p=0.014). Median LVEF and global longitudinal strain [GLS] were 47.5% and 13.4%, respectively, for T2MI, compared to 45% and 13.9%, respectively, for T1MI (p=0.032 and p=0.332, respectively). LV diastolic dysfunction [DD] was observed in 56 (75.7%) T2MI and 77 (88.5%) T1MI patients. Grade III was more frequent in T2MI in comparison with T1MI (14.9% vs 1.1%, p=0.001, respectively), whereas grade I was more common in T1MI patients (75.9% vs 43.2%, p=0.004, respectively). Right ventricular (RV) dysfunction was observed more frequent in T2MI patients, compared to those with T2MI (52.7% vs. 35.6%, p=0.025, respectively). In univariate analysis, grade III DD was significantly associated with MACEs in T2MI (odds ratio [OR] 5.1, 95% confidence interval [CI], 1.3–18.5, p=0.017). In multivariate analysis, GLS ≤ 9.6% (OR = 17.3, 95% CI 3.0-99.5, p=0.001), and prior MI (OR = 16.6, 95% CI 1.7–157.6, p=0.015) were significantly associated with a heightened risk of MACEs in T2MI patients.
Conclusion. Patients with T2MI had high prevalence of LV and RV dysfunction. Echocardiographic assessments, particularly speckle-tracking echocardiography, hold promise in predicting adverse outcomes for these individuals.
Hoang T.H., Maiskov V.V., Merai I.A., Safarova A.F., Kobalava Z.D. Prognostic Significance of Echocardiographic Characteristics in Patients with Type 2 Myocardial Infarction: comparison with Type 1 Myocardial Infarction. Rational Pharmacotherapy in Cardiology. 2023;19(5):461-469. https://doi.org/10.20996/1819-6446-2023-2940. EDN: UIWFYM
Myocardial infarction (MI) is widely acknowledged as the most prevalent clinical manifestation of coronary artery disease, which remains the primary cause of cardiovascular mortality worldwide and leads to significant health implications [1]. According to Fourth Universal Definition, MI is classified into five distinct types, with type 1 and type 2 MI being the most commonly observed ones [1][2]. Type 1 MI (T1MI) is characterized by coronary atherothrombosis resulting from plaque rupture, whereas type 2 MI (T2MI) occurs due to an imbalance between myocardial oxygen supply and demand unrelated to atherothrombosis. Numerous studies have shown that T2MI is associated with poorer short- and long-term outcomes compared to T1MI [3-5]. However, currently, there are no established guidelines for the diagnosis, management, and risk stratification specifically developed for this group of patients.
Echocardiography plays an important role in diagnosis, treatment, and assessment of cardiovascular risk in patients with MI. Clinical outcomes after MI are determined by the initial structural and functional changes resulting from myocardial necrosis, therefore assessment of echocardiographic parameters is of paramount importance in the management of these patients [6-8]. Left ventricular (LV) systolic dysfunction is a common and serious complication of MI, characterized by a decrease in LV ejection fraction (EF) [9]. Additionally, similar to most other heart diseases, MI leads to LV diastolic dysfunction [10][11] and right ventricular (RV) dysfunction [12][13]. The presence of LV diastolic dysfunction and RV involvement after MI is associated with unfavorable in-hospital and long-term prognoses [12-14]. In addition, number of studies with comprehensive assessment of echocardiographic parameters and their relationship with prognosis among T2MI patients are limited [15-18]. Therefore, the aim of this study were to (1) characterize echocardiographic features and (2) investigate prognostic value of these parameters for clinical outcomes in patients with T2MI, compared to T1MI.
Study design and participants
This single-center prospective observational cohort study included patients aged >18 years, presenting to the Intensive Care Unit at Vinogradov City Clinical Hospital in Moscow, with acute MI, who underwent coronary angiography <24 hours after symptom onset from January 1, 2017, to December 31, 2018. Exclusion criteria were patients diagnosed with type 3, 4, and type 5 MI, as well as those who developed MI during hospitalization. Detailed data on demographic and clinical characteristics, medications, as well as laboratory, electrocardiography (ECG), echocardiography, coronary angiography parameters, and clinical complications were collected during the index hospitalization. The study complies with the guidelines of the Declaration of Helsinki and was independently approved by the local Ethics Committee of the Institute of Medicine, Peoples’ Friendship University of Russia. All patients provided written informed consent.
Definition of MI
Myocardial infarction is defined as acute myocardial injury detected by a rise and/or fall of cardiac troponin values, with at least 1 value above the 99th percentile upper reference limit in a clinical setting consistent with acute myocardial ischemia [1].
Adjudication of MI types
For each case, a consensus was reached by two general cardiologists and two board-certified interventional cardiologists. Two general cardiologists assigned the cause of T2MI, while two interventional cardiologists assigned the coronary involvement on all coronary angiography images. T2MI was diagnosed in those with acute myocardial injury and symptoms or signs of myocardial ischemia on the electrocardiography/echocardiography when there was objective evidence of myocardial oxygen supply or demand mismatch, and atherothrombosis was ruled out upon review of coronary angiography. Signs of atherothrombosis [19][20] and clinical criteria of myocardial oxygen demand and supply imbalance used in the present study were described in previous studies [16][21][22] (Table 1). We excluded triggers such as hypotension, respiratory failure, and shock due to uncertainty in the pathogenesis of MI development. Since respiratory failure and shock can develop due to MI complications, for example, on the background of acute HF or within the framework of cardiogenic shock, they are often recorded in ST-segment elevation MI [23].
Table 1. Clinical criteria of type 2 myocardial infarction
|
Atherothrombosis signs on coronary angiography |
Defined as exhibiting any of the following features: (1) an intraluminal filling defect consistent with thrombus, defined as an abrupt vessel cutoff with persistence of contrast, or an intraluminal filling defect in a patent vessel within or next to a stenotic region with surrounding homogeneous contrast opacity; (2) plaque ulceration, defined as contrast and hazy contours beyond the vessel lumen; and (3) plaque irregularity, defined by irregular margins or overhanging edges, and impaired flow [19][20]; |
|
Clinical evidence of myocardial oxygen supply-demand mismatch |
(1) Anemia, defined as hemoglobin ≤ 88.6 g/L for males or ≤80.6 g/L for females (in accordance with previous studies of type 2 myocardial infarction [16][42]), or acute gastrointestinal bleeding, or red blood cell transfusion prior to or within 24 hours following the peak serum troponin; |
|
(2) Severe hypertension, defined as systolic blood pressure (SBP) >180 mm Hg or SBP >160 mm Hg with concomitant progressive retinopathy and/or encephalopathy and/or pulmonary edema requiring treatment with nitrates or diuretics [16][25][42]; |
|
|
(3) Tachyarrhythmia, defined as any rhythm disturbance with a ventricular rate >150 bpm, excluding sinus tachycardia. This encompasses ventricular tachyarrhythmia lasting for 20 minutes, or supraventricular tachyarrhythmia lasting 20 minutes with a ventricular rate exceeding 150 bpm [16][42]; |
|
|
(4) Bradyarrhythmia requiring medical treatment or cardiac pacing [16][25][42]; |
|
|
(5) Respiratory infection determined by clinical signs (flu-like illness with fever, cough, and sore throat) and laboratory tests (increased markers of inflammation) with abnormalities in the physical examination of the respiratory system [22]. |
Abbreviations: SBP — systolic blood pressure.
Echocardiography
All patients underwent an echocardiographic examination using the Vivid 7 ultrasound system (General Electric Healthcare, USA) within 72 hours after hospitalization. The reference limits for all echocardiographic parameters were determined in accordance with American Society of Echocardiography (ASE) guidelines [24]. LV ejection fraction (EF) was determined by the modified biplane Simpson method [24]. LV diastolic dysfunction was determined in accordance with current guidelines [25]. Grade I diastolic dysfunction (impaired relaxation) was established at an E/A ratio ≤0.8 and a peak E-wave velocity ≤0.5 cm/s. Grade II (pseudonormal) diastolic dysfunction at an E/A ratio of 0.8 to 2.0 (or an E/A ratio ≤0.8 with a peak E-wave velocity > 0.5 cm/s), with two of the following indicators: left atrial volume index (LAVi) >34 ml/m², tricuspid regurgitation (TR) velocity > 2.8 m/s, or average E/e’ ratio > 14. Grade III (restrictive) diastolic dysfunction was defined as an E/A ratio ≥2.0. Patients without criteria for grade III diastolic dysfunction were classified as "undefined " (when only two of the three criteria among LAVi, TR velocity, and E/e’ were available, or one was positive, and one was negative). RV systolic function was evaluated by 3 following parameters: tricuspid annular plane systolic excursion (TAPSE), RV fractional area change (FAC), and peak tricuspid annular systolic velocity by pulsed-wave tissue Doppler imaging (S’) in accordance with ASE guidelines [24]. RV systolic dysfunction was established at RV FAC < 35% or S’ <9.5 cm/s or TAPSE < 17 mm [24]. TR velocity was recorded, and pulmonary artery systolic pressure (PASP) was calculated as follows: 4 × (peak TR velocity)² + 5. Speckle-tracking echocardiography was used to evaluate LV global longitudinal strain (GLS) using the Automatic Functional Imaging (AFI) software. GLS was automatically calculated based on data from the apical four-, two-, and three-chamber views using the AFI software. LV systolic function was assessed based on LVEF and GLS. LV systolic function was considered reduced when LVEF <50% [24]. A GLS >20% was considered indicative of preserved global longitudinal LV function [26]. Echocardiography was performed by two experienced sonographers, accredited at the expert level in echocardiography. Intraclass correlation coefficient was used for assessment of intra-observer and inter-observer variability. The inter- and intra-observer coefficients of variation were below 4% and 5%, respectively for all echocardiographic parameters.
Follow-up
The primary outcome was the composite of major cardiovascular adverse events (MACEs) at 1 year that included cardiovascular death, non-fatal MI, nonfatal stroke, and HF-related readmissions. Cause of death was ascertained from hospital records and death registry. Information on HF-related hospitalization was obtained from hospital records, primary care physicians in the outpatient department and telephone contact with the patients or family members and by the HF case managers. HF-related readmissions were defined as admission because of dyspnea with objective signs of pulmonary congestion and treatment with intravenous diuretic agents. All follow-up data for all patients were available until this time.
Statistical analysis
Statistical analysis was performed using IBM SPSS Statistics 25.0 (SPSS Inc., Chicago, IL, USA) and MedCalc Statistical Software version 20.2 (MedCalc Software Ltd, Ostend, Belgium). Quantitative variables are presented as mean ± standard deviation (SD) in normal distribution or median (Me) and interquartile range (IQR) in non-normal distribution. Qualitative variables are presented as frequency and percentage. Data distribution was verified by Kolmogorov-Smirnov and Shapiro-Wilk tests. Comparisons of categorical variables were performed by chi-squared and Fisher’s exact tests. Continuous variables were assessed using paired or unpaired Student’s t test or the Mann-Whitney U test. Univariate logistic regression analysis was used to identify associations with MACEs, generating odds ratios (OR) and their 95% confidence intervals (CIs). To assess prediction ability of continuous variables, receiver operating characteristic (ROC) curve analysis was performed with determining area under the curves (AUCs), their 95% CI, sensitivity, specificity and cut-off value for logistic regression analysis. All factors associated with MACEs then were entered to multivariate logistic regression analysis by stepwise method. All analyses with P values <0.05 were considered significant.
Out of 241 patients with MI who underwent coronary angiography, 161 were included in the study after strict adjudication. Among them, 87 were classified as T1MI and 74 as T2MI. Eighty patients were excluded from the study as follows: 41 — due to clinical criteria indicating myocardial oxygen demand and supply imbalance in T1MI, 39 — due to the absence of atherothrombosis signs on coronary angiography and provoking conditions for T2MI. The median age of T2MI patients was 65 years (males, 55.4%), while 8.1% had ST elevation. Patient characteristics are listed in Table 2. In T2MI patients, hypertension was commonly observed, along with prior MI and diabetes mellitus in one-fifth of cases. T2MI patients had lower median serum troponin and hemoglobin levels compared to T1MI patients. Among the T2MI patients, 56.7% (42 of 74) had obstructive coronary artery disease, and 29.7% (22 patients) of them had three-vessel disease. PCI was indicated in 45.9% of T2MI patients. T2MI patients received evidence-based therapy, including beta-blockers, aspirin/clopidogrel, statins, and either angiotensin-converting enzyme inhibitors or angiotensin receptor blockers (ACEIs/ARBs) in over 90% of cases. The most common causes of supply-demand mismatch were severe hypertension (58.9% [ 51 of 74]), followed by tachyarrhythmia (32% [ 30 of 93]) and anemia (14.9% [ 11 of 74]).
Table 2. Baseline patient Characteristics
|
Variables |
All patients |
T1MI |
T2MI |
P |
|
Number of patients |
161 |
87 |
74 |
|
|
Age, years, Me (IQR) |
63 (55; 69.5) |
60 (53; 68) |
65 (57; 70) |
0.039 |
|
Men, n (%) |
102 (63.4) |
61 (70.1) |
41 (55.4) |
0.071 |
|
ST elevation, n (%) |
67 (41.6) |
61 (70.1) |
6 (8.1) |
<0.001 |
|
Hypertension, n (%) |
141 (87.6) |
71 (81.6) |
70 (94.6) |
0.016 |
|
Prior myocardial infarction, n (%) |
23 (14.3) |
8 (9.2) |
15 (20.3) |
0.069 |
|
Prior revascularization, n (%) |
12 (7.5) |
6 (6.9) |
6 (8.1) |
0.774 |
|
Chronic heart failure, n (%) |
15 (9.3) |
4 (4.6) |
11 (14.9) |
0.031 |
|
Diabetes mellitus, n (%) |
23 (14.3) |
10 (11.5) |
13 (17.6) |
0.367 |
|
Prior stroke/TIA, n (%) |
12 (5.5) |
7 (8.0) |
5 (6.8) |
1.0 |
|
Atrial fibrillation, n (%) |
10 (6.2) |
2 (2.3) |
8 (10.8) |
0.045 |
|
Chronic kidney disease, n (%) |
5 (3.1) |
2 (2.3) |
3 (4.1) |
0.662 |
|
Peripheral artery disease, n (%) |
1 (0.6) |
0 (0) |
1 (1.4) |
0.460 |
|
Chronic obstructive pulmonary disease, n (%) |
20 (13.4) |
10 (11.5) |
10 (13.5) |
0.812 |
|
Systolic BP, mm Hg, Me (IQR) |
140 (120, 166.5) |
130 (115, 140) |
170 (145, 180) |
<0.001 |
|
Heart rate, bpm, Me (IQR) |
80 (68, 92.5) |
76 (68, 88) |
85 (74, 100) |
0.005 |
|
Troponin, ng/mL, Me (IQR) |
0.58 (0.1; 3.91) |
1.78 (0.1; 17.1) |
0.26 (0.09; 1.11) |
<0.001 |
|
Hemoglobin, g/L, Me (IQR) |
141 (129; 149.5) |
143 (134; 153) |
135.5 (120.7; 140) |
<0.001 |
|
Creatinine, µmol/L Me (IQR) |
97 (86; 112) |
96 (85; 108) |
98 (86; 118.5) |
0.317 |
|
Non-obstructive coronary artery disease, n (%) |
32 (19.9) |
0 (0) |
32 (43.2) |
<0.001 |
|
Obstructive coronary artery disease, n (%) |
129 (80.1) |
87 (100) |
42 (56.7) |
<0.001 |
|
1 vessel, n (%) |
29 (18) |
21 (24.1) |
8 (10.8) |
0.039 |
|
2 vessels, n (%) |
30 (18.6) |
18 (20.7) |
12 (16.2) |
0.545 |
|
3 vessels, n (%) |
70 (43.5) |
48 (55.2) |
22 (29.7) |
0.001 |
|
Percutaneous coronary intervention, n (%) |
120 (74.5) |
86 (98.9) |
34 (45.9) |
<0.001 |
|
Beta-blockers, n (%) |
150 (93.2) |
82 (94.3) |
68 (91.9) |
0.756 |
|
ACEi/ARBs, n (%) |
144 (89.4) |
78 (89.7) |
66 (89.2) |
1.0 |
|
Aspirin, n (%) |
147 (91.3) |
87 (100) |
60 (81.1) |
<0.001 |
|
P2Y12 inhibitors, n (%) |
158 (98.1) |
87 (100) |
71 (95.9) |
0.095 |
|
Statins, n (%) |
158 (98.1) |
87 (100) |
71 (95.9) |
0.095 |
|
Anticoagulants, n (%) |
18 (11.2) |
3 (3.4) |
15 (20.3) |
0.001 |
|
Primary cause of supply-demand imbalance |
||||
|
Coronary vasospasm, n (%) |
- |
- |
4 (5.4) |
- |
|
Anemia, n (%) |
- |
- |
11 (14.9) |
- |
|
Severe hypertension, n (%) |
- |
- |
51 (58.9) |
- |
|
Respiratory infection, n (%) |
- |
- |
7 (9.5) |
- |
|
Tachyarrhythmia, n (%) |
- |
- |
19 (25.7) |
- |
|
Bradyarrhythmia, n (%) |
- |
- |
4 (5.4) |
- |
|
Number of supply-demand imbalance etiologies |
||||
|
Single, n (%) |
- |
- |
56 (75.7) |
- |
|
Multiple, n (%) |
- |
- |
18 (24.3) |
- |
T1MI — type 1 myocardial infarction,
T2MI — type 2 myocardial infarction,
ACEi — angiotensin-converting enzyme inhibitors,
ARBs — angiotensin II receptor blockers,
BP — blood pressure,
IQR — interquartile range,
Me — median,
TIA — transient ischemic attack
LV systolic function
Among T2MI patients, the median LVEF was 47.5% (IQR: 40-56%), with 55.4% showing reduced EF (LVEF <50%), while the median LVEF for T1MI patients was 45% (IQR: 40-48%), with reduced EF in 75.9% of cases (Table 3). The proportion of patients with LVEF ≤40% was similar between T1MI and T2MI, accounting for one-fourth of each. The median GLS was 13.4% for type 2 MI patients and 13.9% for type 1 MI patients, with no significant difference observed.
Table 3. Echocardiographic data of patients with type 1 and type 2 myocardial infarction
|
Variable |
All patients (n=161) |
T1MI (n=87) |
T2MI (n=74) |
P |
|
systolic function |
||||
|
EF, %, Me (IQR) |
(40; 54) |
(40; 48) |
47.5 (40; 56) |
0.032 |
|
EF ≥50%, n (%) |
(33.5) |
(24.1) |
(44.6) |
0.014 |
|
41-49%, n (%) |
(39.8) |
(48.3) |
(29.7) |
|
|
≤40%, n (%) |
(26.7) |
(27.6) |
(25.7) |
|
|
GLS, %, Me (IQR) |
13.9 (11.1; 17.1) |
13.9 (11.4; 17.1) |
13.4 (10.1; 16.8) |
0.332 |
|
Hypo-/akinesia, n (%) |
(62.1) |
(75.9) |
(45.9) |
<0.001 |
|
Dyskinesia, n (%) |
(9.9) |
(14.9) |
(4.1) |
0.032 |
|
diastolic function |
||||
|
E-wave, cm/sec, Me (IQR) |
70.7 (55.3; 83) |
70.9 (52.8; 82) |
69.3 (56.7; 83.1) |
0.908 |
|
A-wave, cm/sec, Me (IQR) |
74.4 (60.9; 88) |
(61; 86) |
75.2 (56.8; 89.8) |
0.957 |
|
E/A ratio, Me (IQR) |
0.86 (0.71; 1.29) |
0.87 (0.73; 1.19) |
0.86 (0.67; 1.42) |
0.769 |
|
E/A ≤0,8, n (%) |
(44.1) |
(44.8) |
(43.2) |
0.874 |
|
E/A >0,8 и <2, n (%) |
(48.4) |
(54.0) |
(41.9) |
0.155 |
|
E/A ≥2, n (%) |
(7.5) |
(1.1) |
(14.9) |
0.001 |
|
TDI septal e’ (cm/sec), Me (IQR) |
6.4 (4; 8.9) |
(5.2; 9.5) |
6.1 (4; 9) |
0.005 |
|
TDI lateral e’ (cm/sec), Me (IQR) |
8.7 (6; 10.9) |
(7.7; 11) |
(5; 10) |
0.002 |
|
E/e’ average, Me (IQR) |
7.75 (5.94; 11.5) |
7.15 (5.64; 9.21) |
8.5 (6.37; 14.5) |
0.006 |
|
E/e’ average >14, n (%) |
(18.0) |
(8.0) |
(29.7) |
<0.001 |
|
E/e’ average <10, n (%) |
(69.6) |
(80.5) |
(56.8) |
0.002 |
|
E/e’ average ≥10 и ≤14, n (%) |
(12.4) |
(11.5) |
(13.5) |
0.812 |
|
DT, msec, Me (IQR) |
(144; 237) |
(136; 206) |
187.5 (153.5; 233) |
0.037 |
|
Diastolic dysfunction grade |
||||
|
Normal, n (%) |
(18.8) |
(11.5) |
(24.3) |
|
|
Grade I, n (%) |
(59) |
(75.9) |
(43.2) |
0.004 |
|
Grade II, n (%) |
(13.7) |
(11.5) |
(17.6) |
0.774 |
|
Grade III, n (%) |
(7.5) |
(1.1) |
(14.9) |
0.001 |
|
LA size |
||||
|
LAVi, ml/m², Me (IQR) |
32.9 (24.7; 41.5) |
31.9 (25; 38.5) |
34.2 (24.3; 45.5) |
0.244 |
|
LAVi >34 ml/m², n (%) |
(48.1) |
(42.5) |
(55.4) |
0.116 |
|
RV systolic function |
||||
|
TR velocity, m/sec, Me (IQR) |
2.26 (158; 271) |
1.52 (2.22; 2.70) |
2.29 (1.59; 2.72) |
0.105 |
|
TR velocity >2.8 m/sec, n (%) |
(19.9) |
(19.5) |
(20.3) |
1.0 |
|
PASP, mm Hg, Me (IQR) |
(16; 35) |
24.5 (15.8; 33.2) |
(16; 35) |
0.623 |
|
TAPSE, mm, Me (IQR) |
20.5 (17; 23) |
(18; 23) |
(16; 24) |
0.431 |
|
TAPSE/PASP, mm Hg, Me (IQR) |
0.85 (0.57; 1.3) |
0.89 (0.57; 1.3) |
0.81 (0.51; 1.29) |
0.393 |
|
RV FAC, %, Me (IQR) |
(33; 56) |
(36.2; 54.4) |
(32.1; 54.8) |
0.618 |
|
S’, mm, Me (IQR) |
12.9 (11; 14.9) |
(11.4; 14.9) |
12.6 (9; 15.4) |
0.089 |
|
RV systolic dysfunction, n (%) |
(43.5) |
(35.6) |
(52.7) |
0.025 |
|
TAPSE <17 mm, n (%) |
(20.5) |
(13.8) |
(28.4) |
0.03 |
|
RV FAC <35%, n (%) |
(26.1) |
(23) |
(29.7) |
0.367 |
|
S’ velocity <9.5 cm/sec, n (%) |
(14.3) |
(4.6) |
(25.7) |
<0.001 |
|
Valvular disease |
||||
|
Aortic stenosis, n (%) |
(6.2) |
(1.2) |
(12.2) |
0.006 |
|
Mitral stenosis, n (%) |
(0.6) |
(0) |
(1.4) |
0.462 |
T1MI — type 1 myocardial infarction,
T2MI — type 2 myocardial infarction,
EF — ejection fraction,
FAC — fractional area change,
GLS — global longitudinal strain,
IQR — interquartile range,
LAVi — left atrial volume index,
LV — left ventricle,
PASP — pulmonary arterial systolic pressure,
RV — right ventricle,
TAPSE — tricuspid annular plane systolic excursion,
TDI — tissue doppler imaging,
TR — tricuspid regurgitation
LV diastolic function
Left atrial enlargement was noted in 55.4% of patients with T2MI and 42.5% of patients with T1MI, with no significant difference between the groups. Diastolic dysfunction was present in 75.7% of T2MI patients, with 32.5% having moderate or severe dysfunction. Elevated LV filling pressure, defined by an average E/e′ ratio ≥14, was observed in 29.7% of T2MI patients compared to 8.0% in T1MI patients (p<0.001).
The median TR velocity was 2.29 m/s, and a velocity >2.8 m/s was found in 20.3% of T2MI patients (see Table 3). RV systolic dysfunction was more frequent in T2MI patients compared to T1MI patients (52.7% vs. 35.6%, p=0.025). Reduced RV FAC was present in 29.7%, and abnormal TAPSE was noted in 28.4% among T2MI patients.
Mitral and Aortic Valve Disease
Aortic stenosis was more frequent in T2MI patients compared to T1MI patients (12.2% vs 1.2%, p=0.006). Mitral stenosis was rare in both type 1 and type 2 MI, noted in only 1.4% of type 2 MI cases.
Factors associated with MACE during follow-up
There were 36 MACEs (including 3 deaths, 5 MIs, 2 strokes, and 26 HF-related readmissions) within 12 months, with 18 events for each MI type. Among T2MI patients, the echocardiographic factors associated with MACEs in the univariate analysis were GLS, e’, E/e’ ratio, PASP, TAPSE, TAPSE/PASP ratio, and E/A ratio (Table 4).
Table 4. Prognostic performance of echocardiographic parameters
in patients with type 2 myocardial infarction
|
Variables |
Univariate Analysis, Odds ratio (95%CI) |
P |
Multivariate Analysis, Odds ratio (95%CI) |
P |
|
Prior myocardial infarction |
3.8 (1.1-12.8) |
0.03 |
16.6 (1.7-157.6) |
0.015 |
|
GLS ≤9.6% |
15.7 (4.2-58.8) |
<0.001 |
17.3 (3.0-99.5) |
0.001 |
|
e’ average ≤5 cm/sec |
5.1 (1.6-16.0) |
0.005 |
11.2 (1.0-139.5) |
0.06 |
|
E/e’ average >11.59 |
5.5 (1.7-17.2) |
0.004 |
1.4 (0.1-19.3) |
0.822 |
|
PASP > 25 mm Hg |
3.7 (1.1-12.9) |
0.036 |
2.0 (0.2-23.9) |
0.595 |
|
TAPSE/PASP ≤0.8 |
5.0 (1.4-17.4) |
0.011 |
4.5 (0.4-51.5) |
0.229 |
|
E/A ≥2 |
5.1 (1.3-19.5) |
0.017 |
1.4 (0.1-17.0) |
0.768 |
|
LV EF |
0.944 (0.888-1.005) |
0.069 |
1.019 (0.934-1.111) |
0.674 |
CI — confidence interval,
EF — ejection fraction,
GLS — global longitudinal strain,
LV — left ventricle,
PASP — pulmonary artery systolic pressure,
TAPSE — tricuspid annular plane systolic excursion
In the multivariate analysis, after adjusting for age, sex, and prior MI, GLS ≤9.6% (OR=17.3, 95% CI 3.099.5, p=0.001) and prior MI (OR=16.6, 95% CI 1.7157.6, p=0.015) remained significantly associated with a heightened risk of MACEs. The ROC curve analysis demonstrated that GLS exhibited good discrimination in predicting MACEs among T2MI patients (AUC=0.815, 95% CI 0.706-0.896, p<0.0001, cut-off value =9.6%, sensitivity 61.1%, specificity 90.9%) (Fig. 1).
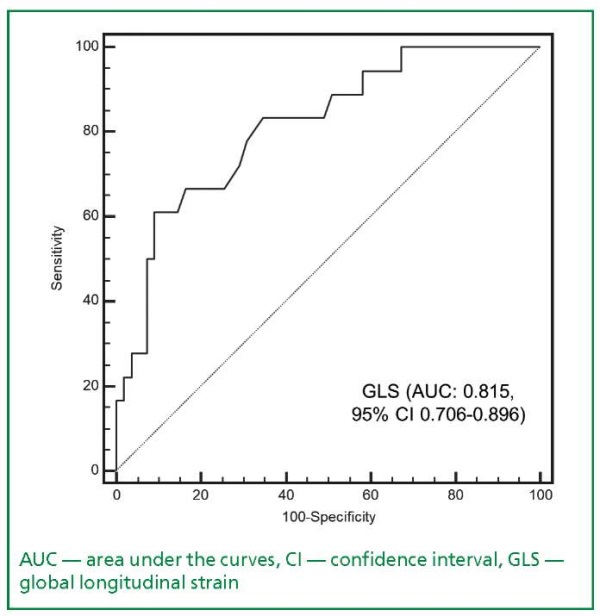
Figure 1. Receiver operating characteristic curve
depicting the performance of global longitudinal strain
in prediction of major adverse cardiovascular events
in patients with type 2 myocardial infarction
Furthermore, when normal diastolic function was used as the reference, restrictive diastolic dysfunction grade was found to be significantly associated with an increased risk of MACEs in T2MI patients (OR=5.1, 95% CI, 1.3-18.5, p=0.017) (Table 5).
Table 5. Association between diastolic dysfunction grade
and major adverse cardiovascular events
in patients with type 1 and type 2 myocardial infarction
|
Diastolic dysfunction grade |
Type 1 myocardial infarction |
P |
Type 2 myocardial infarction |
P |
|
Odds ratio (95%CI) |
Odds ratio (95%CI) |
|||
|
I |
6.9 (0.8-55.7) |
0.068 |
2.2 (0.7-7.7) |
0.1134 |
|
II |
2.5 (0.3-21.6) |
0.390 |
1.5 (0.4-5.6) |
0.553 |
|
III |
- |
- |
5.1 (1.3-19.5) |
0.017 |
CI — confidence interval
In this study, we initially performed echocar diographic examinations to assess the prognostic value in patients with T2MI. Our findings revealed that T2MI patients had a higher LVEF compared to T1MI patients, and the proportion of patients with LVEF <50% was lower in the T2MI group. This observation could be attributed to the relatively low occurrence of new regional wall abnormalities in T2MI patients. In contrast, some previous studies reported lower LVEF in patients with T2MI, with values around 40-45% compared to 50% in T1MI patients [15-18]. However, another study showed no significant difference in LVEF between the two groups (LVEF of 54% for T2MI and 56% for T1MI, p=0.172) [18].
Using speckle-tracking echocardiography, we assessed global longitudinal LV systolic strain in T2MI patients, which was found to be 95.9% with a median GLS of 13.4%. GLS decrease was associated with an increased probability of MACEs during the 1-year follow-up, aligning with previously published studies [27-29]. This study is the first to demonstrate the clinical value of GLS in risk stratification among T2MI patients. For instance, Ersbøll et al. [29] studied 849 patients hospitalized with MI and LVEF >40% and found that GLS < 14% was associated with a three-fold increased risk of all-cause mortality and re-hospitalization for decompensated heart failure (Hazard ratio [HR] 3.21, 95% CI: 1.82-5.67, p <0.001) within 2.5 years compared to the group with GLS ≥14%. Moreover, GLS <14% was significantly associated with cardiovascular mortality (HR 12.7, 95% CI: 3.0-54.6, p<0.001).
In this study, we identified LV diastolic dysfunction in 75.7% of patients with T2MI and 88.1% of patients with T1MI, which aligns with the literature data for MI [30][31]. Notably, T2MI patients showed a higher occurrence of grade II and III LV diastolic dysfunction (32.5% vs 12.6%), leading to significant differences in echocardiographic parameters between T2MI and T1MI.
This could be attributed to higher rates of E/A ratio >2 and E/e’ ratio >14 in T2MI, characteristic of the restrictive LV diastolic dysfunction. Severe LV diastolic dysfunction in our study was associated with an increased risk of MACEs, consistent with previous studies [32-34]. For instance, Pozzoli et al. [35] demonstrated that early (3-12 weeks) LV diastolic dysfunction (E/A ratio >1) after MI in patients with EF <40% (n=107) was associated with a higher risk of death, heart transplantation, and re-hospitalization for heart failure (HR 4.1, 95% CI 1.9-9.9, p=0.0017) during 2 years of follow-up.
The predominance of restrictive LV diastolic dysfunction in T2MI in our study could be attributed to markedly increased LV filling pressure, leading to increased left atrial pressure and eventually resulting in pulmonary hypertension. These findings are in the line with previously published data [36][37]. Both Pozzoli et al. [37] and Giannuzzi et al. [36] established a strong association between restrictive filling and pulmonary capillary wedge pressure in MI patients (r=0.83, p<0.001).
Limited data were available on the echocardiographic characteristics of patients with T2MI. López-Cuenca et al. [18] conducted a study with 707 patients with T1MI and 117 patients with T2MI, revealing higher rates of aortic stenosis (24% vs. 5%, p <0.001) and mitral regurgitation (20% vs. 10%, p=0.001) in the T2MI group compared to T1MI. However, there were no significant differences in aortic and tricuspid regurgitation between the two groups. Aortic stenosis has been considered a clinical condition associated with myocardial oxygen demand and supply imbalance, leading to adjustments in T2MI diagnosis in some studies [17][38-41]. For instance, Stein et al. [17] detected aortic stenosis in 10 (8%) of 127 patients with T2MI in their study. In a multicenter population-based prospective study with 4572 MI patients admitted to the intensive care unit, 862 (19%) cases were diagnosed with T2MI, and aortic stenosis was detected in 10% of these patients, consistent with our findings [39].
In our study, clinical conditions such as severe hypertension (58.9%), tachyarrhythmia (25.7%), anemia (14.9%), and respiratory infection (9.5%) were significant contributors to T2MI. However, in multivariate analysis, we did not find significant evidence of these factors increasing the risk of MACEs within 12 months. The role of these factors have been demonstrated in previous studies, including anemia [42][43], infections [43][44], and provoking conditions [45]. This lack of significance may be attributed to the relatively small size of the type 2 MI cases in our study, which could have hindered to detect these associations.
With expanded echocardiography in these patients, we have contributed new data on the assessment of LV and RV function, as well as the risk stratification value of LV GLS. Our study has opened up new possibilities for using echocardiography, particularly the assessment of LV GLS, as a predictor of major adverse outcomes within 12 months (including death, recurrent MI, stroke, and HF-related rehospitalization). Additionally, our findings on the prevalence of restrictive LV diastolic dysfunction among T2MI patients and its related outcomes prompt further research.
The present study had several limitations. Firstly, the sample size was relatively small, and patient enrollment was restricted to the intensive care unit, making it difficult to generalize the results to the entire T2MI population. Some T2MI patients may have been hospitalized in other departments with comorbidities, potentially affecting echocardiography results. Additionally, not using tagged magnetic resonance imaging as a reference method for evaluating GLS was a drawback. Furthermore, the study lacked the use of intravascular ultrasound or optical coherence tomography angiography to detect acute atherosclerotic plaque disruption or atherothrombosis, which could have aided in establishing MI type diagnosis and potentially introduced patient selection bias.
Among patients with T2MI, there were notable occurrences of both LV and RV dysfunctions. Echocardiographic evaluations, including speckle-t racking echocardiography, hold promise in predicting adverse outcomes for these individuals. Moreover, the significant association between grade III LV diastolic dysfunction and adverse outcomes highlights the potential of echocardiography in guiding management strategies for this high-risk patient group.
Relationships and Activities. None.
Funding. The study was performed with the support of "RUDN University Program 5-100".
1. Thygesen K, Alpert JS, Jaffe AS, et al. Fourth universal definition of myocardial infarction (2018). Eur Heart J. 2019;40(3):237-269. doi:10.1093/eurheartj/ehy462
2. Vargas KG, Haller PM, Jäger B, et al. Variations on classification of main types of myocardial infarction: a systematic review and outcome meta-analysis. Clin Res Cardiol. 2019;108(7):749-762. doi:10.1007/s00392-018-1403-3
3. St John Sutton M, Lee D, Rouleau JL, et al. Left ventricular remodeling and ventricular arrhythmias after myocardial infarction. Circulation. 2003;107(20):2577-2582. doi:10.1161/01.cir.0000070420.51787.a8
4. Gaudron P, Eilles C, Kugler I, Ertl G. Progressive left ventricular dysfunction and remodeling after myocardial infarction. Potential Mechanisms and Early Predictors. Circulation. 1993;87(3):755–763. doi:10.1161/circ.89.4.8149558
5. Pfeffer MA, Braunwald E. Ventricular remodeling after myocardial infarction: Experimental observations and clinical implications. Circulation. 1990;81(4):1161-1172. doi:10.1161/01.CIR.81.4.1161
6. Minicucci MF, Azevedo PS, Polegato BF, Paiva SAR, Zornoff LAM. Heart failure after myocardial infarction: Clinical implications and treatment. Clin Cardiol. 2011;34(7):410-414. doi:10.1002/clc.20922
7. Nishimura RA, Tajik AJ. Evaluation of Diastolic Filling of Left Ventricle in Health and Disease: Doppler Echocardiography Is the Clinician’s Rosetta Stone. J Am Coll Cardiol. 1997;30(1):8-18. doi:10.1016/S0735-1097(97)00144-7
8. Ohno M, Cheng C, Little WC. Mechanism of Altered Patterns of Left Ventricular Filling During the Development of Congestive Heart Failure. Circulation. 1994;89:2241–2250.
9. Piccolo R, Niglio T, Spinelli L, et al. Reperfusion correlates and clinical outcomes of right ventricular dysfunction in patients with inferior ST-segment elevation myocardial infarction undergoing percutaneous coronary intervention. Am J Cardiol. 2014;114(2):243-249. doi:10.1016/j.amjcard.2014.04.034
10. Haddad F, Doyle R, Murphy DJ, Hunt SA. Right ventricular function in cardiovascular disease, part II: Pathophysiology, clinical importance, and management of right ventricular failure. Circulation. 2008;117(13):1717-1731. doi:10.1161/CIRCULATIONAHA.107.653584
11. Di Bella G, Siciliano V, Aquaro GD, et al. Right ventricular dysfunction: an independent and incremental predictor of cardiac deaths late after acute myocardial infarction. Int J Cardiovasc Imaging. 2015;31(2):379-387. doi:10.1007/s10554-014-0559-9
12. Saaby L, Poulsen TS, Diederichsen ACP, et al. Mortality rate in type 2 myocardial infarction: Observations from an unselected hospital cohort. Am J Med. 2014;127(4):295-302. doi:10.1016/j.amjmed.2013.12.020
13. Saaby L, Poulsen TS, Hosbond S, et al. Classification of myocardial infarction: Frequency and features of type 2 myocardial infarction. Am J Med. 2013;126(9):789-797. doi:10.1016/j.amjmed.2013.02.029
14. Stein GY, Herscovici G, Korenfeld R, et al. Type-II myocardial infarction – Patient characteristics, management and outcomes. PLoS One. 2014;9(1):e84285. doi:10.1371/journal.pone.0084285
15. López-Cuenca A, Gómez-Molina M, Flores-Blanco PJ, et al. Comparison between type-2 and type-1 myocardial infarction: Clinical features, treatment strategies and outcomes. J Geriatr Cardiol. 2016;13(1):15-22. doi:10.11909/j.issn.1671-5411.2016.01.014
16. Ambrose JA, Winters SL, Stern A, et al. Angiographie morphology and the pathogenesis of unstable angina pectoris. J Am Coll Cardiol. 1985;5(3):609-616. doi:10.1016/S0735-1097(85)80384-3
17. Qiao J, Fishbein MC. The Severity of Coronary Atherosclerosis at Sites of Plaque Rupture With Occlusive Thrombosis. J Am Coll Cardiol. 1991;17(5):1138-1142. doi:10.1016/0735-1097(91)90844-Y
18. Landes U, Bental T, Orvin K, et al. Type 2 myocardial infarction: A descriptive analysis and comparison with type 1 myocardial infarction. J Cardiol. 2016;67(1):51-56. doi:10.1016/j.jjcc.2015.04.001
19. Ruane L, Buckley T, Hoo SYS, et al. Triggering of acute myocardial infarction by respiratory infection. Intern Med J. 2017;47(5):522-529. doi:10.1111/imj.13377
20. Ibanez B, James S, Agewall S, et al. 2017 ESC Guidelines for the Management of Acute Myocardial Infarction in Patients Presenting With ST-segment Elevation. Eur Heart J. 2018;39(2):119–177. doi:10.1093/eurheartj/ehx393
21. Lang RM, Badano LP, Mor-Avi V, et al. Recommendations for cardiac chamber quantification by echocardiography in adults: An update from the American society of echocardiography and the European association of cardiovascular imaging. Eur Heart J Cardiovasc Imaging. 2015;16(3):233-271. doi:10.1093/ehjci/jev014
22. Nagueh SF, Smiseth OA, Appleton CP, et al. Recommendations for the evaluation of left ventricular diastolic function by echocardiography: An update from the American society of echocardiography and the European association of cardiovascular imaging. J Am Soc Echocardiogr. 2016;29(4):277-314. doi:10.1093/ehjci/jew082
23. Favot M, Courage C, Ehrman R, Khait L, Levy P. Strain Echocardiography in Acute Cardiovascular Diseases. West J Emerg Med. 2016;17(1):54-60. doi:10.5811/westjem.2015.12.28521
24. Munk K, Andersen NH, Terkelsen CJ, et al. Global left ventricular longitudinal systolic strain for early risk assessment in patients with acute myocardial infarction treated with primary percutaneous intervention. J Am Soc Echocardiogr. 2012;25(6):644-651. doi:10.1016/j.echo.2012.02.003
25. Bendary A, Tawfeek W, Mahros M, Salem M. The predictive value of global longitudinal strain on clinical outcome in patients with ST-segment elevation myocardial infarction and preserved systolic function. Echocardiography. 2018;35(7):915-921. doi:10.1111/echo.13866
26. Ersbøll M, Valeur N, Mogensen UM, et al. Prediction of all-cause mortality and heart failure admissions from global left ventricular longitudinal strain in patients with acute myocardial infarction and preserved left ventricular ejection fraction. J Am Coll Cardiol. 2013;61(23):2365-2373. doi:10.1016/j.jacc.2013.02.061
27. Poulsen SH, Jensen SE, Egstrup K. Longitudinal changes and prognostic implications of left ventricular diastolic function in first acute myocardial infarction. Am Heart J. 1999;137(5):910-918. http://www.ncbi.nlm.nih.gov/pubmed/10220641. Accessed December 1, 2018.
28. Azoz A, Youssef A, Alshehri A, et al. Correlation between ST segment shift and cardiac diastolic function in patients with acute myocardial infarction. J Electrocardiol. 2018;51(4):592-597. doi:10.1016/j.jelectrocard.2018.03.006
29. Meta-Analysis Research Group in Echocardiography (MeRGE) AMI Collaborators, Møller JE, Whalley GA, et al. Independent prognostic importance of a restrictive left ventricular filling pattern after myocardial infarction an individual patient meta-analysis: Meta-analysis research group in echocardiography acute myocardial infarction. Circulation. 2008;117(20):2591-2598. doi:10.1161/CIRCULATIONAHA.107.738625
30. Zhou Y, Liu L, Cheng T, et al. Grade 3 Echocardiographic Diastolic Dysfunction Is Associated With Increased Risk of Major Adverse Cardiovascular Events After Surgery: A Retrospective Cohort Study. Anesth Analg. 2019;129(3):651-658. doi:10.1213/ANE.0000000000003807
31. Halley CM, Houghtaling PL, Khalil MK, Thomas JD, Jaber WA. Mortality rate in patients with diastolic dysfunction and normal systolic function. Arch Intern Med. 2011;171(12):1082-1087. doi:10.1001/archinternmed.2011.244
32. Pozzoli M, Capomolla S, Sanarico M, Pinna G, Cobelli F, Tavazzi L. Doppler evaluations of left ventricular diastolic filling and pulmonary wedge pressure provide similar prognostic information in patients with systolic dysfunction after myocardial infarction. Am Heart J. 1995;129(4):716-725. doi:10.1016/0002-8703(95)90321-6
33. Giannuzzi P, Imparato A, Temporelli PL, et al. Doppler-derived mitral deceleration time of early filling as a strong predictor of pulmonary capillary wedge pressure in postinfarction patients with left ventricular systolic dysfunction. J Am Coll Cardiol. 1994;23(7):1630-1637. doi:10.1016/0735-1097(94)90667-X
34. Pozzoli M, Capomolla S, Opasich C, et al. Left ventricular filling pattern and pulmonary wedge pressure are closely related in patients with recent anterior myocardial infarction and left ventricular dysfunction. Eur Heart J. 1992;13(8):1067-1073. doi:10.1093/oxfordjournals.eurheartj.a060315
35. Sandoval Y, Smith SW, Sexter A, et al. Type 1 and 2 Myocardial Infarction and Myocardial Injury: Clinical Transition to High-Sensitivity Cardiac Troponin I. Am J Med. 2017;130(12):1431-1439.e4. doi:10.1016/j.amjmed.2017.05.049
36. Putot A, Jeanmichel M, Chague F, Manckoundia P, Cottin Y, Zeller M. Type 2 Myocardial Infarction: A Geriatric Population-based Model of Pathogenesis. Aging Dis. 2020;11(1):108-117. doi:http://dx.doi.org/10.14336/AD.2019.0405
37. Gard A, Lindahl B, Batra G, Hjort M, Szummer K, Baron T. Diagnosing type 2 myocardial infarction in clinical routine. A validation study. Scand Cardiovasc J. 2019;53(5):259-265. doi:10.1080/14017431.2019.1638961
38. Smilowitz NR, Weiss MC, Mauricio R, et al. Provoking conditions, management and outcomes of type 2 myocardial infarction and myocardial necrosis. Int J Cardiol. 2016;218:196-201. doi:10.1016/j.ijcard.2016.05.045
Truong Huy Hoang.
Ho Chi Minh City
Victor V. Maiskov.
Moscow
Imad A. Merai.
Moscow
Ayten F. Safarova.
Moscow
Zhanna D. Kobalava.
Moscow
Hoang T.H., Maiskov V.V., Merai I.A., Safarova A.F., Kobalava Z.D. Prognostic Significance of Echocardiographic Characteristics in Patients with Type 2 Myocardial Infarction: comparison with Type 1 Myocardial Infarction. Rational Pharmacotherapy in Cardiology. 2023;19(5):461-469. https://doi.org/10.20996/1819-6446-2023-2940. EDN: UIWFYM
.jpg)
Editor-in-Chief
 Drapkina O. M.
Moscow 101990, Russia
Petroverigsky per. 10
Tel.: +7 (499) 553 68 10
е-mail: otsec.rfc@mail.ru


